

Boston Focus, 1.23.26
The ups and downs of school staffing

The state’s annual release of teacher data has some good news: Massachusetts definitely does not have a teacher shortage.
The short-term disruption of the pandemic and the rise of more flexible/remote work options raised flags. Would teachers stay after the trials of remote school and the bumpy return to classrooms? Could the field continue to attract recent college graduates when many other jobs do not require an employee to be in the same place all day?
The great resignation did not come to Massachusetts schools; as I have written before, educator retention rates have been pretty stable.
But perhaps the best evidence that the Bay State enjoys some sort of comparative advantage (perhaps from high compensation and benefits, well-funded schools and good working conditions, and/or density of higher education institutions) is that we can hire a lot more teachers than we used to.
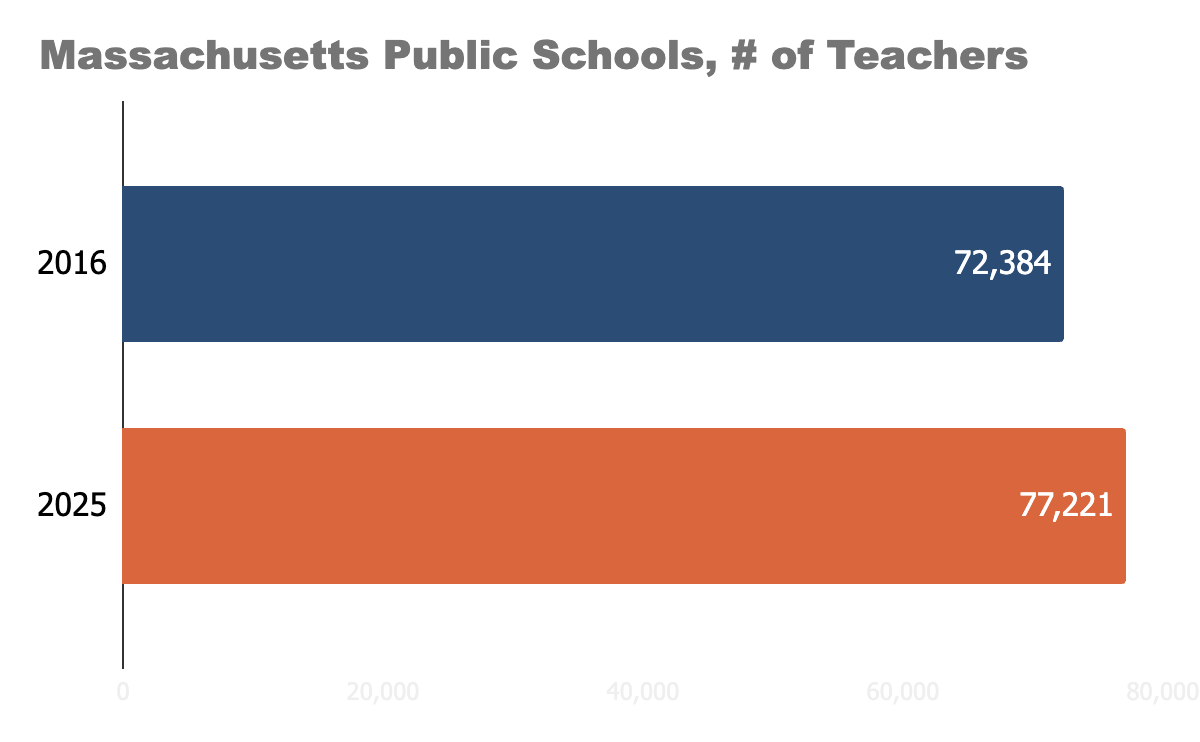
Massachusetts employs ~8% more teachers than it did a decade ago.
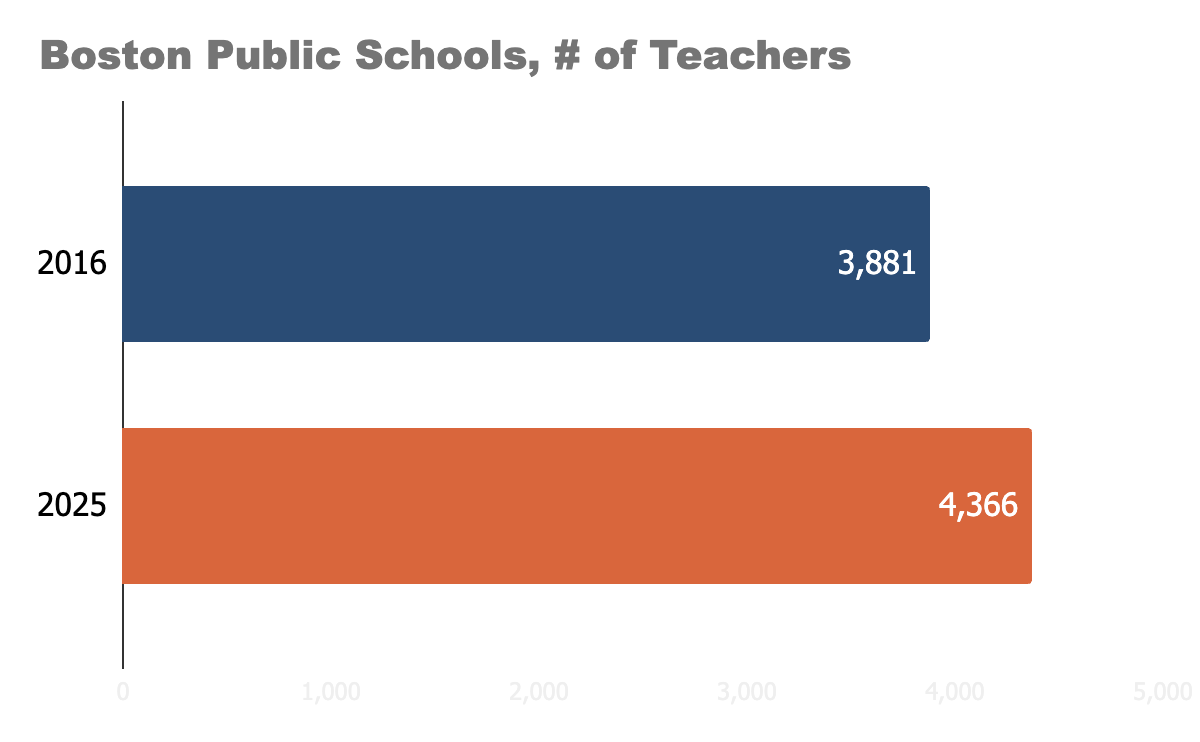
Boston is even more fortunate; hiring is up ~12%.
It is important to note that these are broad averages. Just because hiring is up across Massachusetts, it does not mean that some school districts struggle to add and fill positions. Boston may have got better at hiring more teachers faster, but it is rare for a school not to start a year with an open position, or have to make due when there is a mid-year departure.
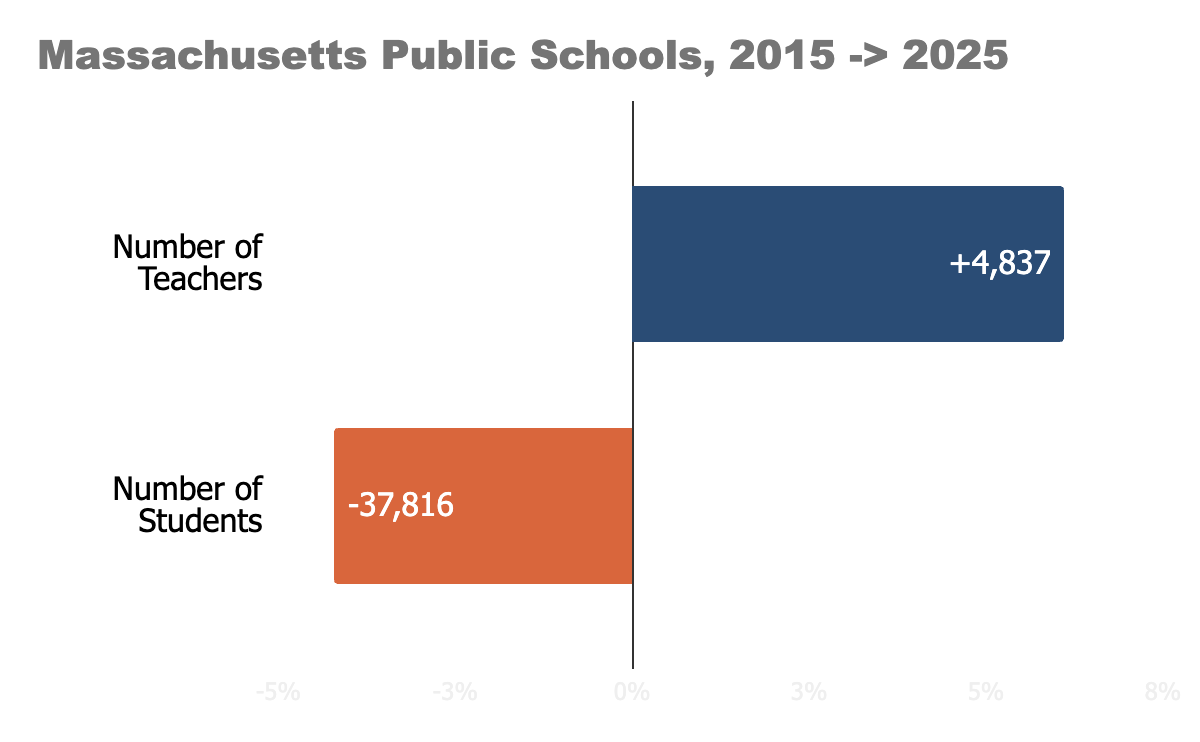
This increase in the teacher workforce is all the more exceptional when you consider the countervailing trends during the same time period. The most important, of course, was the decline in student enrollment.
While Massachusetts school districts added nearly 5,000 new teachers, there were nearly 38,000 fewer students for them to teach in their classrooms.
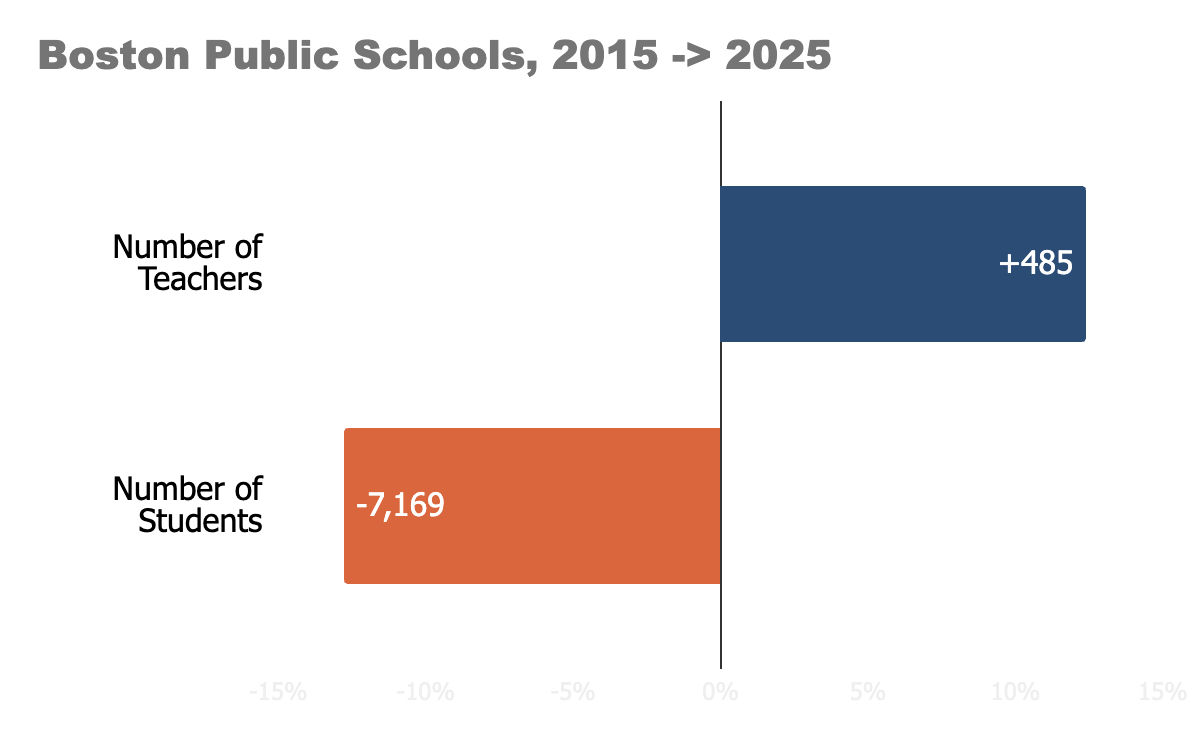
On a percentage basis, Boston’s split is more stark.
Simple division yields a lower ratio of students to teachers. Intuitively, most people think this will mean improved student outcomes.
Except that the National Assessment of Educational Progress (NAEP), the “Nation’s Report Card,” does not show that at all.
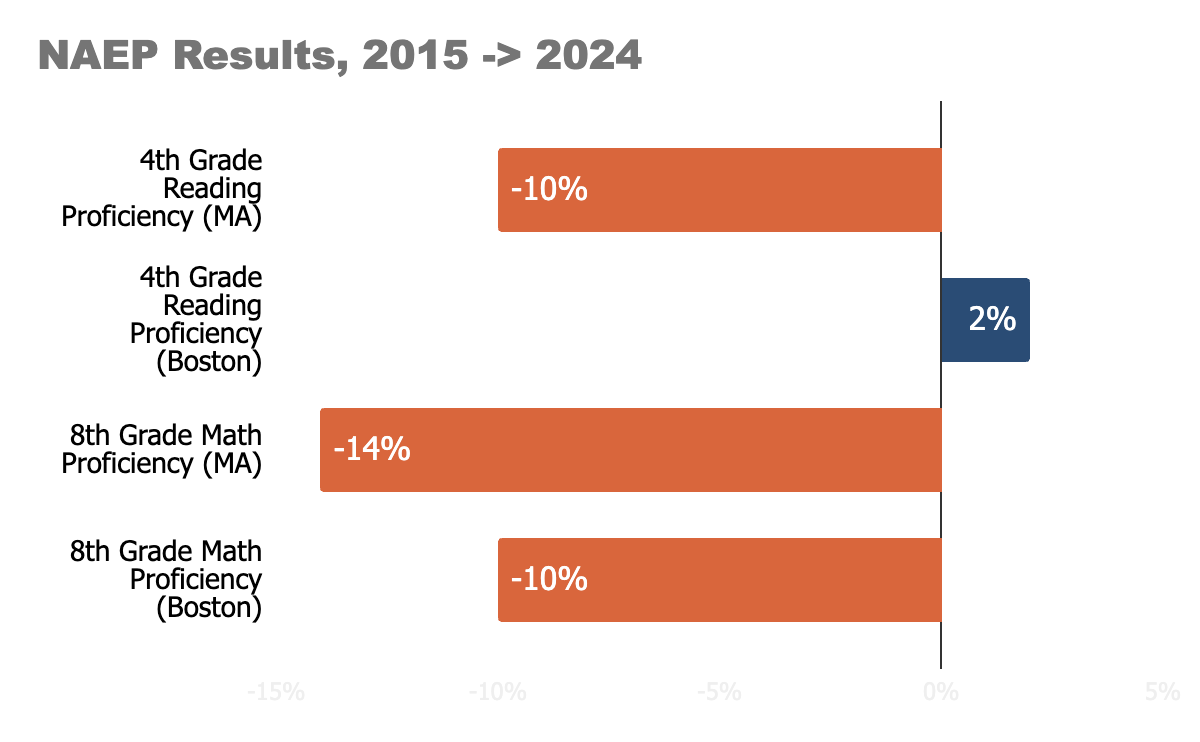
Now, there are several arguments out there explaining these declines. The pandemic, of course. The end of robust accountability systems. A video of a cognitive scientist ascribing blame to screens and social media made the rounds this week.
Hindsight is a bit moot here, as it offers little aid in the budget conditions Massachusetts public schools now find themselves in, and in the future.
Public school spending nearly doubled (unadjusted for inflation) in Massachusetts and Boston during this time.
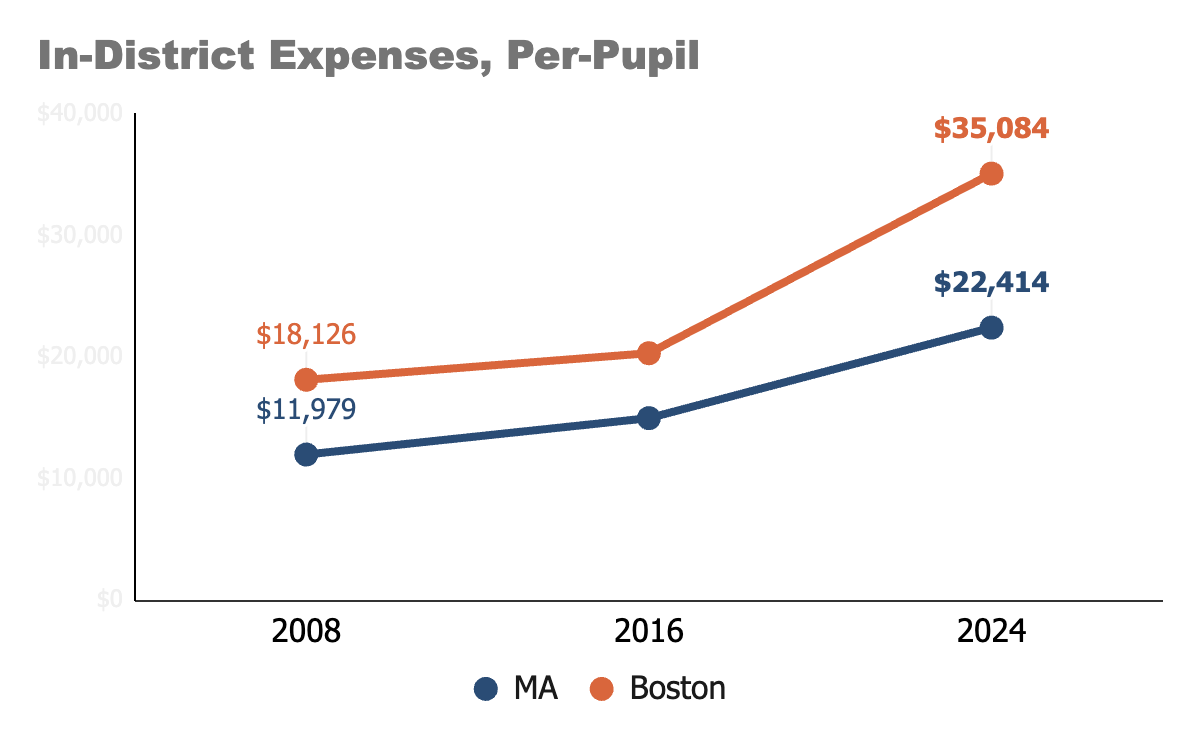
This is not just because of more money coming into the system. The per-pupil spending is increasing partially because there are just fewer pupils. The larger number does not represent new investments or resources; it is just the function of a smaller denominator. This is the tough math that pencils out to a school district like Boston spending $35,000 per student, but now asking schools not to buy paper.
Massachusetts and Boston are not alone here. The educator workforce across America has increased over the past two decades, just as much of the country has started to or is heading into a downturn in its student population.
Ease of hiring is a luxury many school districts may not be able to afford.
Schools
Boston School Committee met this week. Full materials here, which don’t include the Superintendent’s report or public comment. To get that, you either have to be there or listen to this.
Franklin Cummings Tech opened its new building in Nubian Square this week. Formerly located in the Back Bay, the technical college owes its name to two donors: Benjamin Franklin’s bequest in 1789 and a more recent gift from Bill and Joyce Cummings.
The college serves a disproportionately low-income population of 1,125 students who receive hands-on career and technical education. The new building cost $75M. For those watching school construction in Roxbury, that is ~10% of the potential cost of the proposed new Madison Park campus. Madison Park currently enrolls 1,024 students.
Governor Maura Healey committed a portion of her State of the Commonwealth speech to education. Returning to “early” themes (more PreK, more Early College), the Governor also mentioned tutoring and literacy (a Senate bill is now moving on that topic). The Governor also staked out a strong position in limiting social media for young people.
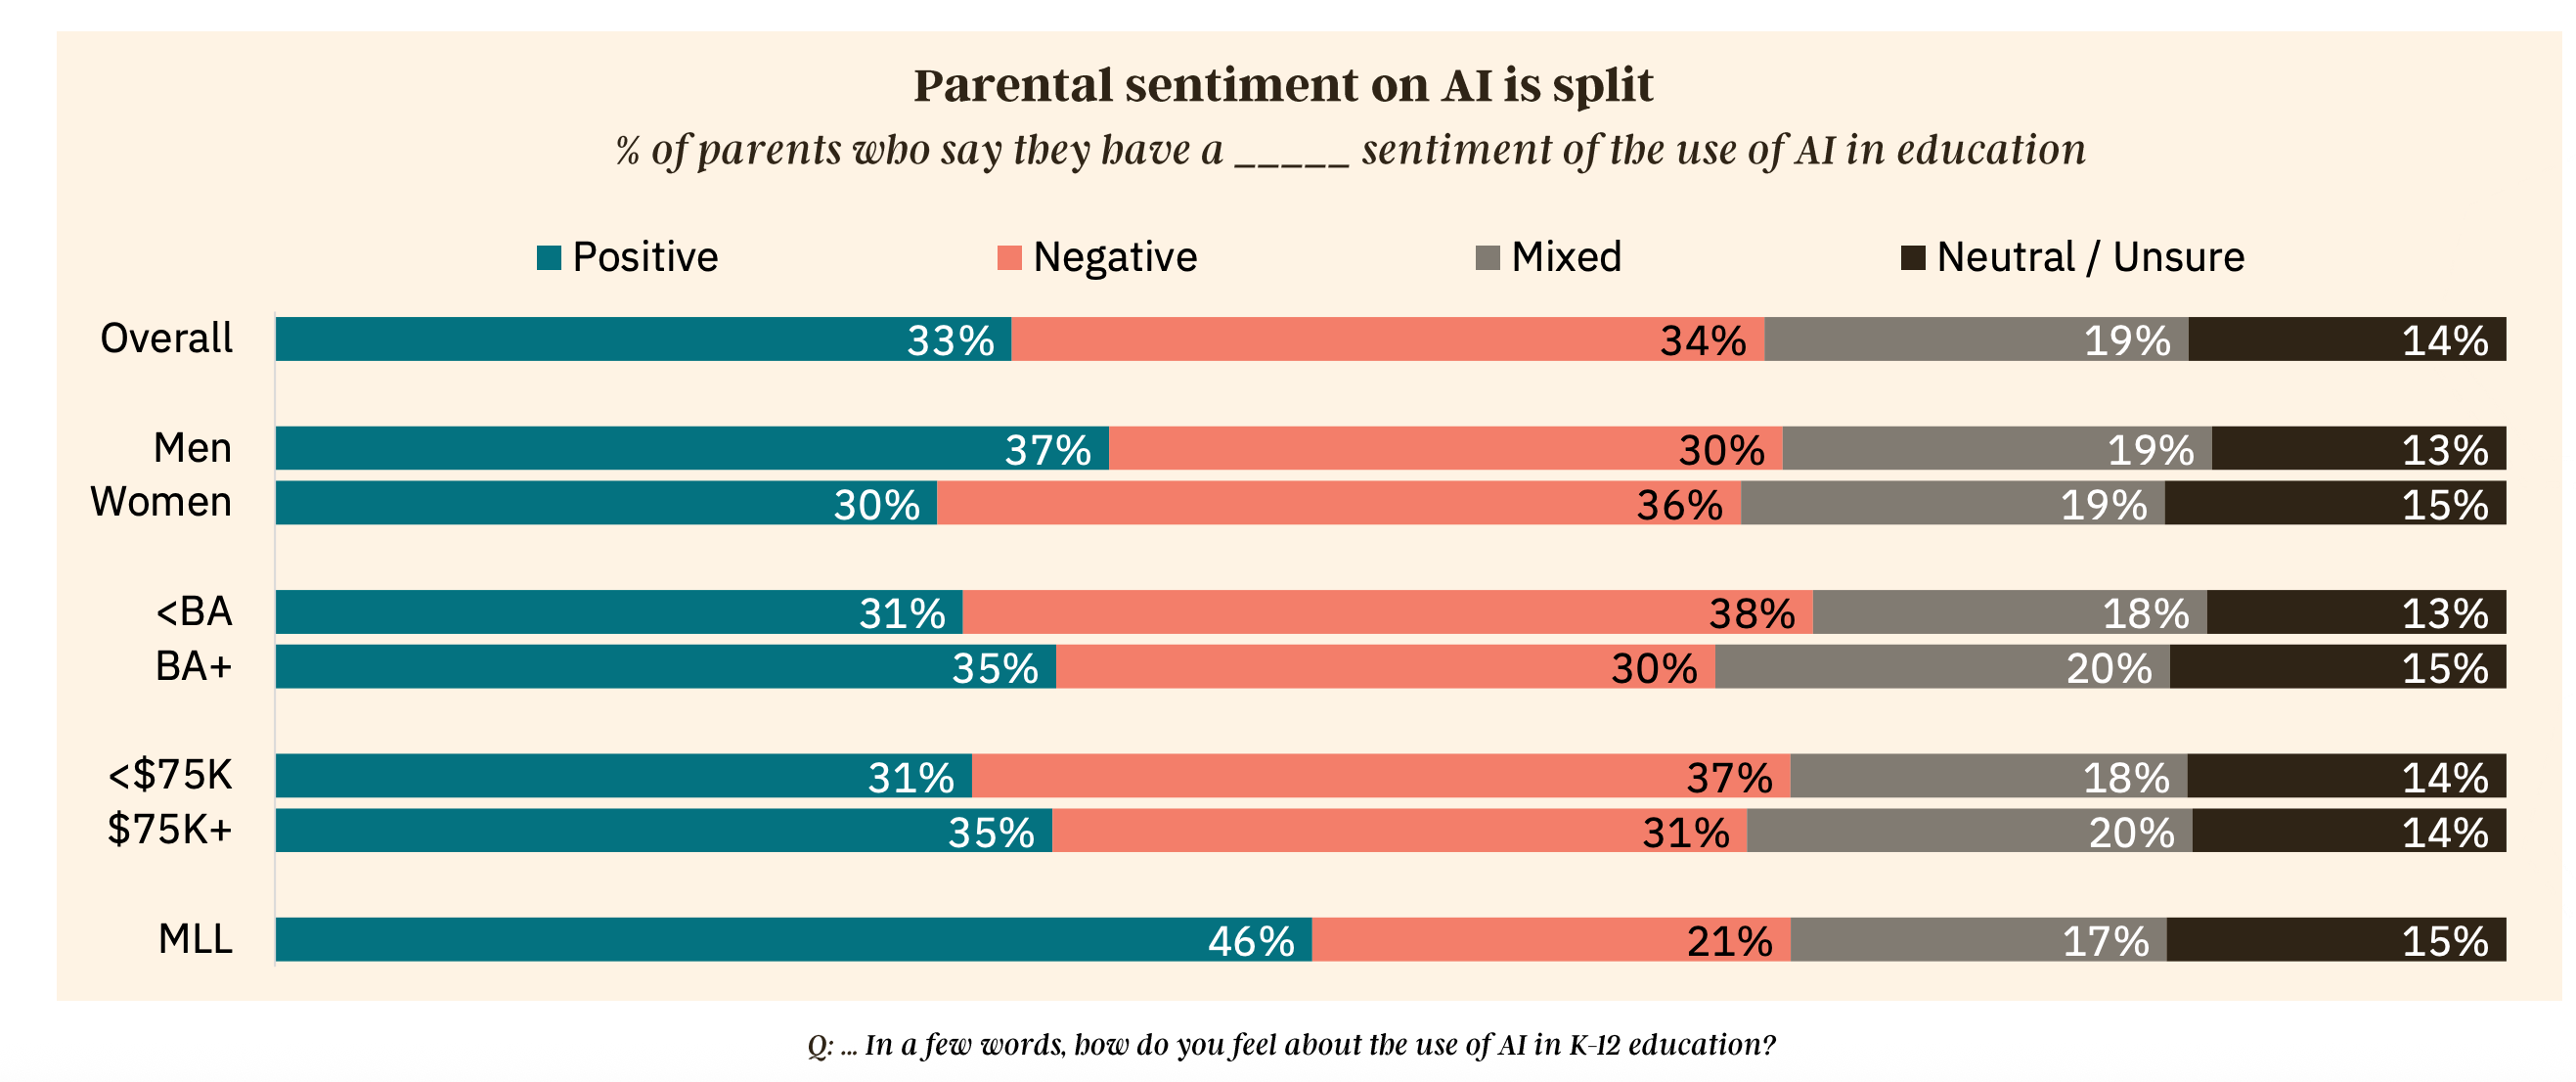
Families appear to share some of that tech angst. A new poll from MassInc and EdTrust examines Massachusetts families’ attitudes on artificial intelligence and technology. Full results here. The upshot? There is not a lot of consensus.
Massachusetts “Schools of Recognition” were recognized this week.
Other Matters
Most people love that there is more Patriots football right now, but that also means more sports gambling ads.
You won’t see any for Kalshi, one of the nascent prediction markets that allow you to bet basically on anything. A Massachusetts Superior Court judge sided with Attorney General Campbell in blocking Kalshi from opening a sportsbook.
Why is this important? Kalshi argues it is not a gambling outfit; it engages in “futures contracts” that are regulated by the federal government. If this passes legal muster at some point, not only will there be an added sports gambling outfit, Massachusetts would receive zero tax revenue from it.
How long before you think FanDuel would make the same argument?
Really interesting dataon the spending vs outcomes gap. The fact that per-pupil spending nearly doubled but NAEP scores dropped is the kind of thing people dunno how to explain without pointing fingers. I think the smaller denominator point is crucial here cause districts look flush on paper while school budgets are actually getting squeezed. That Franklin Cummings comparison to Madison Park is wild tho.
I assume the spend per pupil chart does not control for inflation. $100 in 2008 was roughly $145 in 2024 so the spending per pupil up 50% rather than doubled.