

Boston Focus, 2.7.25
Some things I have read through recently...

Wednesday’s Boston School Committee meeting featured the annual rollout of budget increases and initiatives. The details come in future meetings, so the presentation is relatively high level: 3.5% more in funding and a list of priorities.
With inflation, the end of ESSER funding, declines in NAEP, and federal threats, there is even more attention on school funding than usual. These factors are leading to headlines like this across Massachusetts and prompting lawmakers to consider reopening the state education formula for the second time in five years.
They may have a point.
In 1993, Massachusetts adopted a comprehensive, progressive funding system for its schools. The state would begin spending a lot more on education. The state would provide aid to school districts with less resources and/or higher need students. Communities with more wealth and property tax revenue would receive less state funding, leveling the playing field. The formula was updated in 2019 with the Student Opportunity Act (SOA).
With this background in mind, recently released school funding data from 2023 does not look how you would expect.
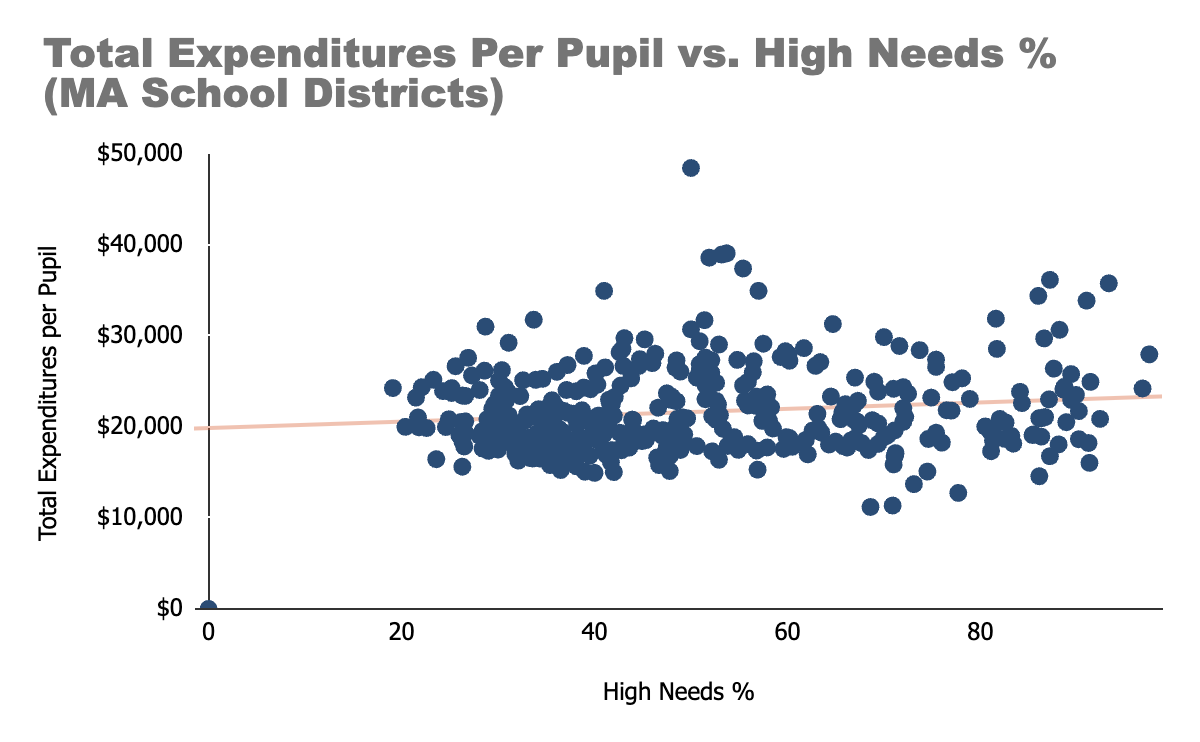
Don’t look too hard for a trend. There isn’t one, just a very weak correlation (0.14).
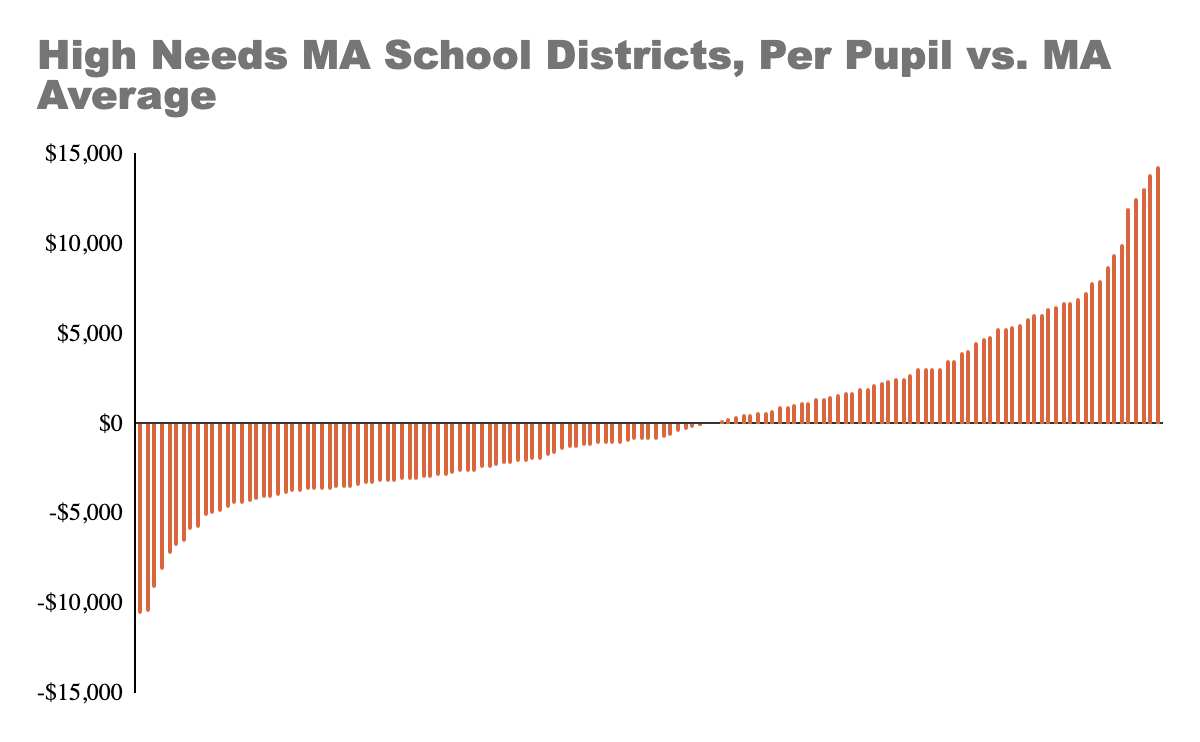
There are 141 Massachusetts districts and charter schools that serve a higher percentage of high needs students than the state average. If the formula was functioning as intended, you would expect to see higher per-pupil spending.
But, you don’t. The majority of those high percentage, high needs districts spent less per-pupil than the state average in 2023.
Boston schools are fortunate to be on the right side of the graph above. But that comes at its own, unique cost.
Boston has a big tax base, which means the state formula requires a higher local contribution. Boston has a lot charter schools, whose budgets funded completely by state aid. The result: little remaining state aid actually goes to BPS. These high per-pupil expenditures, for a high needs population, are being largely paid for by the city of Boston.
Schools have grown to be 39% of the city’s budget.
Eventually, more for one city department may mean less for another.
Schools
The budget was not the only big item on the School Committee agenda Wednesday night. Without the MCAS requirement, Boston must set a new high school graduation standard (you have to pass classes). Exam school admissions got another tweak. And there was a report on prospective building repairs, but not the closures and mergers recently announced.
A BPS counselor again was named best in the Commonwealth.
It is a mayoral election year, so elected school committee in Boston is back on the table.
Two more tough, but fair, national assessments of NAEP here and here, and a Massachusetts focus here.
The Houston ISD receivership has turned into an experiment of classroom standardization.
Free community college in Massachusetts has expanded access and costs.
Different sides of the same coin with the Trump Administration signing executive orders to push private school choice and eliminate the Department of Education. What would the latter actually mean? Hard to glean a philosophy here, delegating authority while also telling people what to do. Massachusetts is an early test case.
Other Matters
From classical theory to modern thinking like “abundance,” it is assumed that economic growth is good and produces more good things.
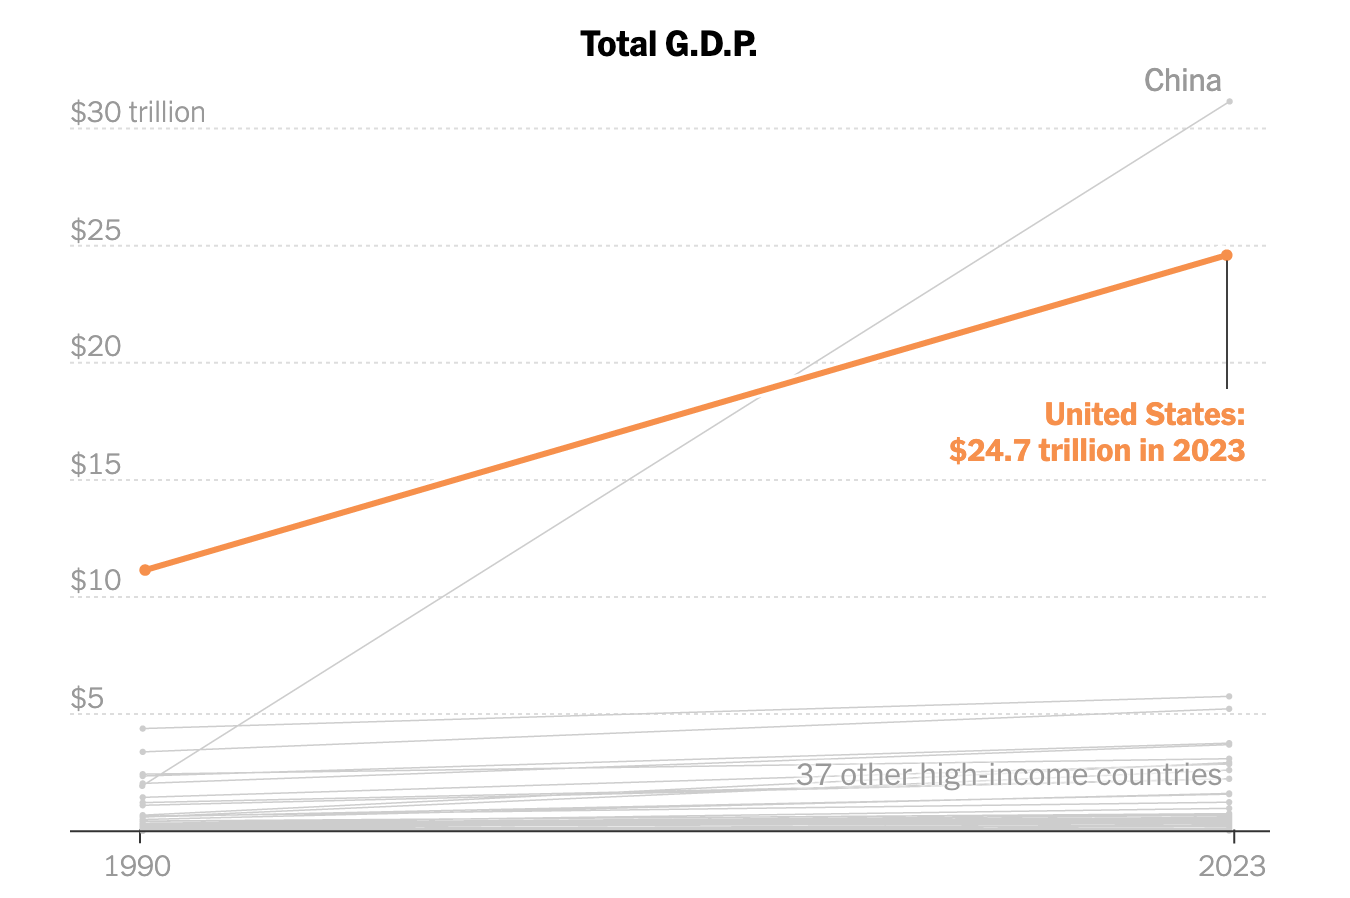
So if America continues to expand economically, why are Americans sad?
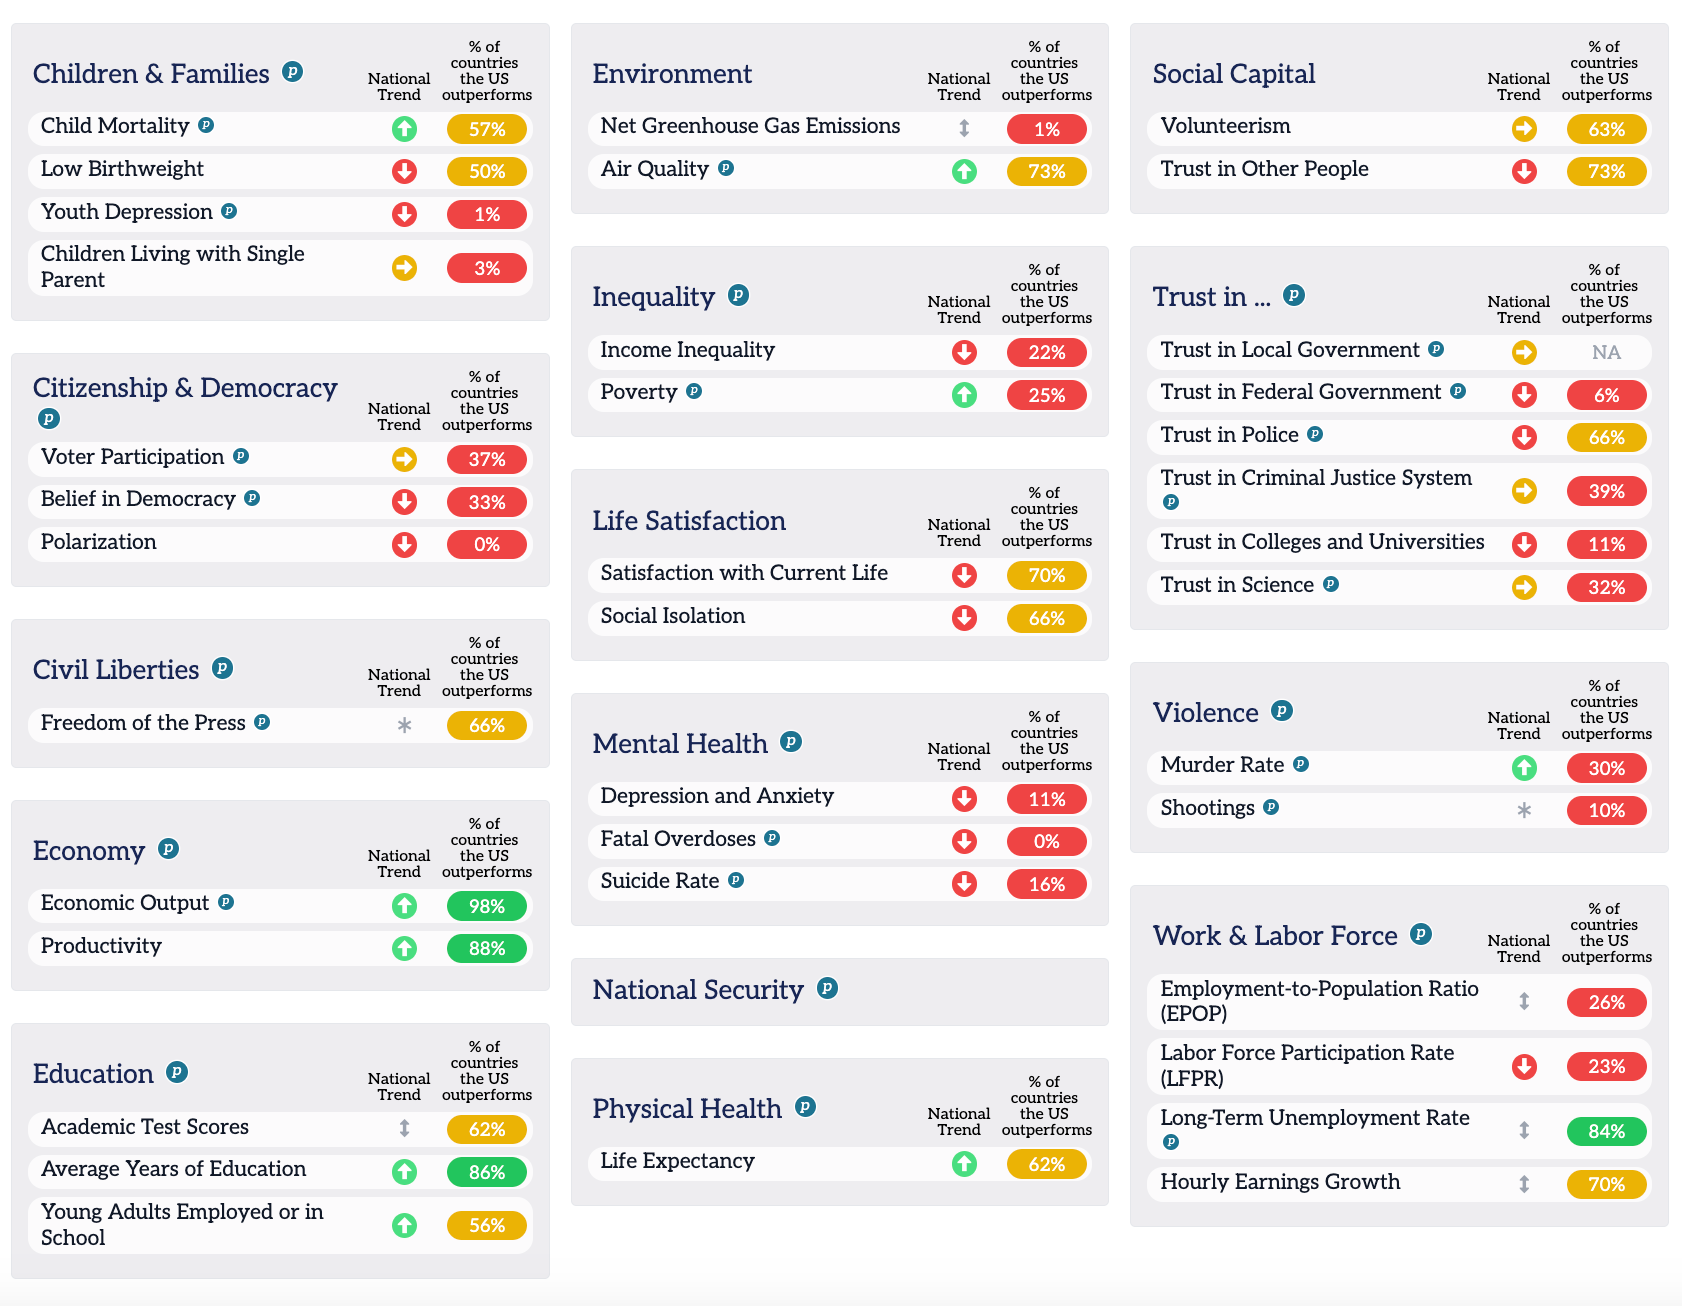
While leading in economic growth and employment, Americans are lagging and even finishing last for kids’ mental health, drug overdoses, and polarization on the just-released State of the Nation Project report.
The measures are real, but many are subjective (e.g., “satisfaction with current life”) and sound really hard to change (e.g., “trust in federal government”). Plus, this many line graphs in one place lends itself to mistaken correlations, covariation, etc.
What explains this then?
Perhaps, it is income inequality. It has become such a hard-wired fact of American life that wealth and opportunity are becoming increasingly concentrated that we barely notice it anymore. America is near the bottom of the sample for the Gini coefficient (the metric used to measure a country’s inequality). As inequality has risen, well-being declined.
It’s a local problem, too. By the same measure, if Boston were a country, it would be Saudi Arabia.
These trends are not immutable. The data above also indicates Americans breathe pretty clean air because pollution, a negative externality of economic development, was curbed by governmental regulations and enforcement. Until now, at least.
In public policy and pop culture, we are often too quick to identify a singular, all-explaining problem or solution. But when you look at these measures - and how intricately they are tied to resources, access to information and education, and feelings of control or agency - it is hard not to see the costs of more wealth not being spread around.
Yes, you raise the right point. There is no way to prove causality on any of this. Income inequality was a hypothesis to test and was curious to the see the reaction.
Are we sad because we have the luxury to be sad? If it were income equality you would get a diagonal line if you plotted wealth and mental health on and x and y axis. And I don't think that is the case right now.