

Boston Focus, 6.12.26
What the focus on inclusion leaves out

Inclusion was supposed to fix a lot.
That is what we heard from advocates, educators, and eventually district and city leaders. It is even in the Boston teachers’ contract.
Broadly speaking, “inclusion” is the practice of teaching students with disabilities alongside their general education peers and avoiding segregated settings. When this was first being discussed seriously in Boston ~15 years ago, it made all the sense in the world.
Facing increasing needs and costs, separate classrooms took up space and cost more money; it would be better and more efficient to have more students in general education classrooms, and provide differentiated support. There was an additional social-emotional upside; with no one excluded, everyone would benefit from expanded, diverse peer groups. We even had nationally recognized models here to emulate; there were literally movies made about the O’Hearn (later renamed Henderson, for its principal).
But, according to this recently released state report, Boston has the 4th highest rate of students in separate programming, and is in the lowest quartile for its share of students enrolled in full inclusion.
If everyone agrees we should be doing this, why aren’t we doing it?
The answer is complicated. Let’s start with special education generally. The worthwhile and federally protected goal to ensure services for all learners has a downside: an immense amount of compliance, paperwork, and meetings, all with acronyms, timelines, and required attendees and signatures, all of which is routinely audited by the state or federal government and/or subject to complaints or lawsuits.
On top of that, inclusion models often require additional staffing, which is hard to afford even in normal financial times. Boston is a big city with a high needs population; there are likely more students that have disabilities that require too much attention and modifications to be in a general education classroom.
And it wouldn’t be right to exclude simple execution from the list; after all, the audit that nearly led to state receivership described special education in Boston in “systemic disarray.”
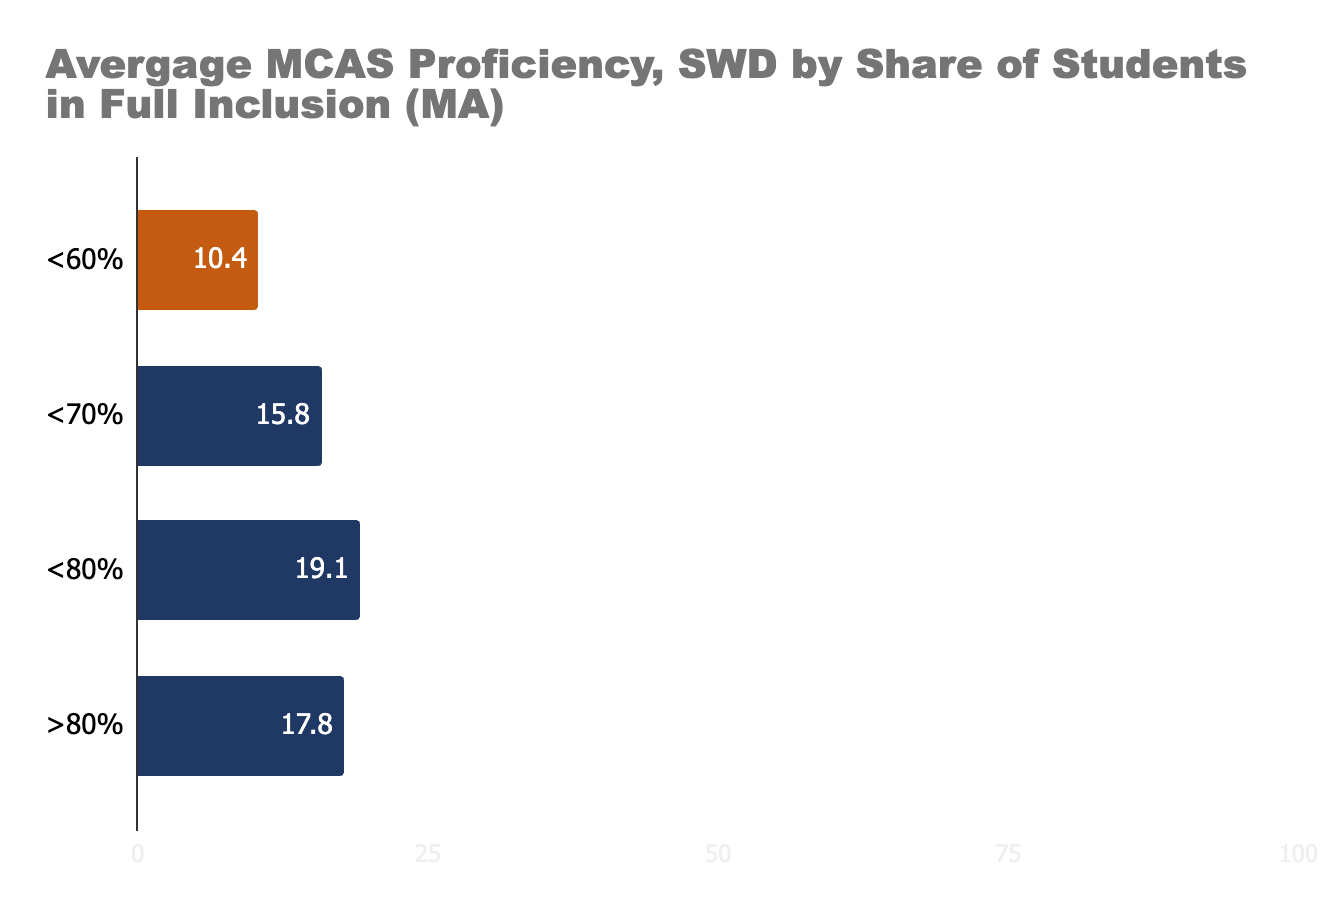
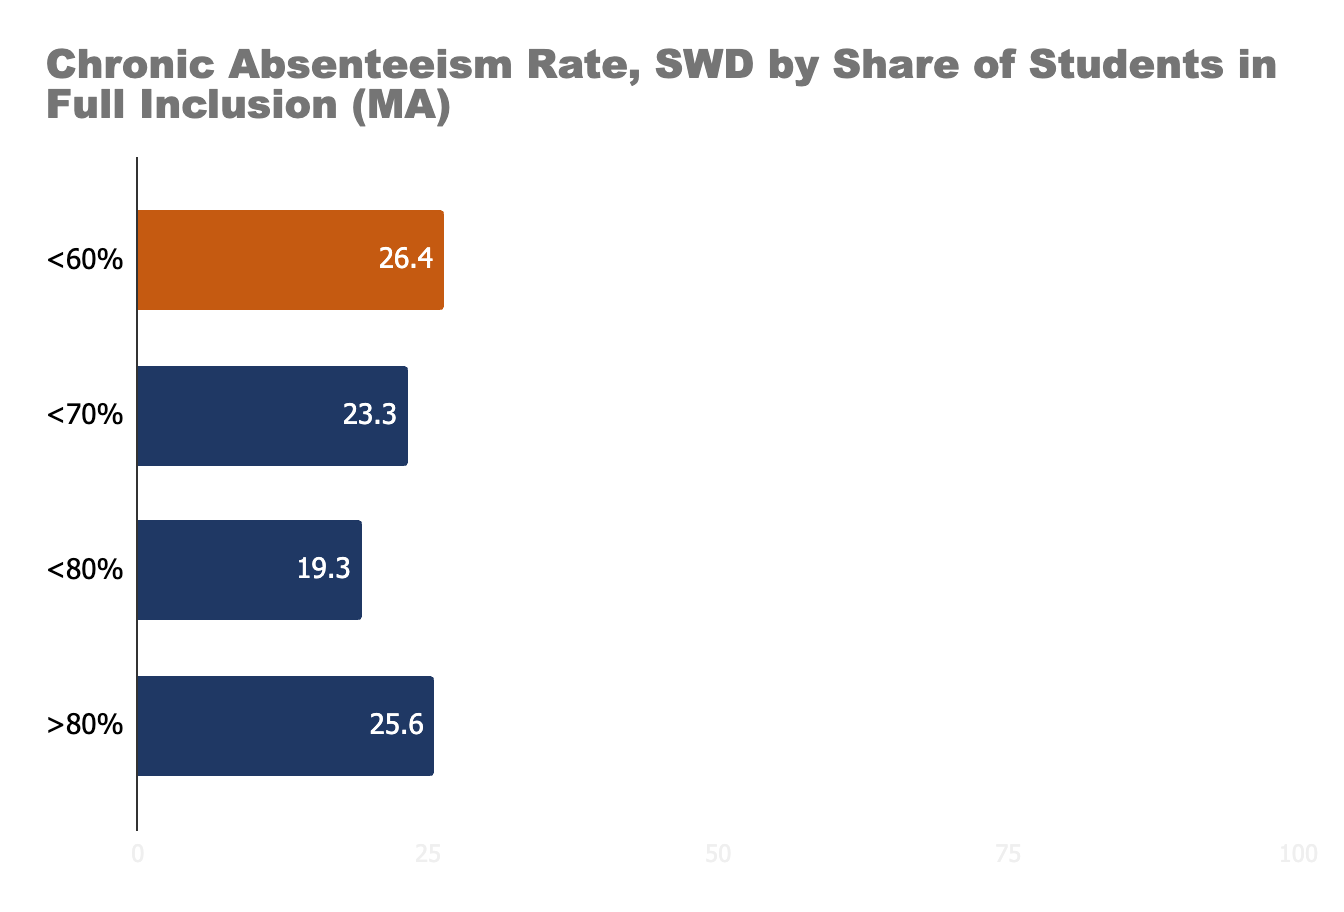
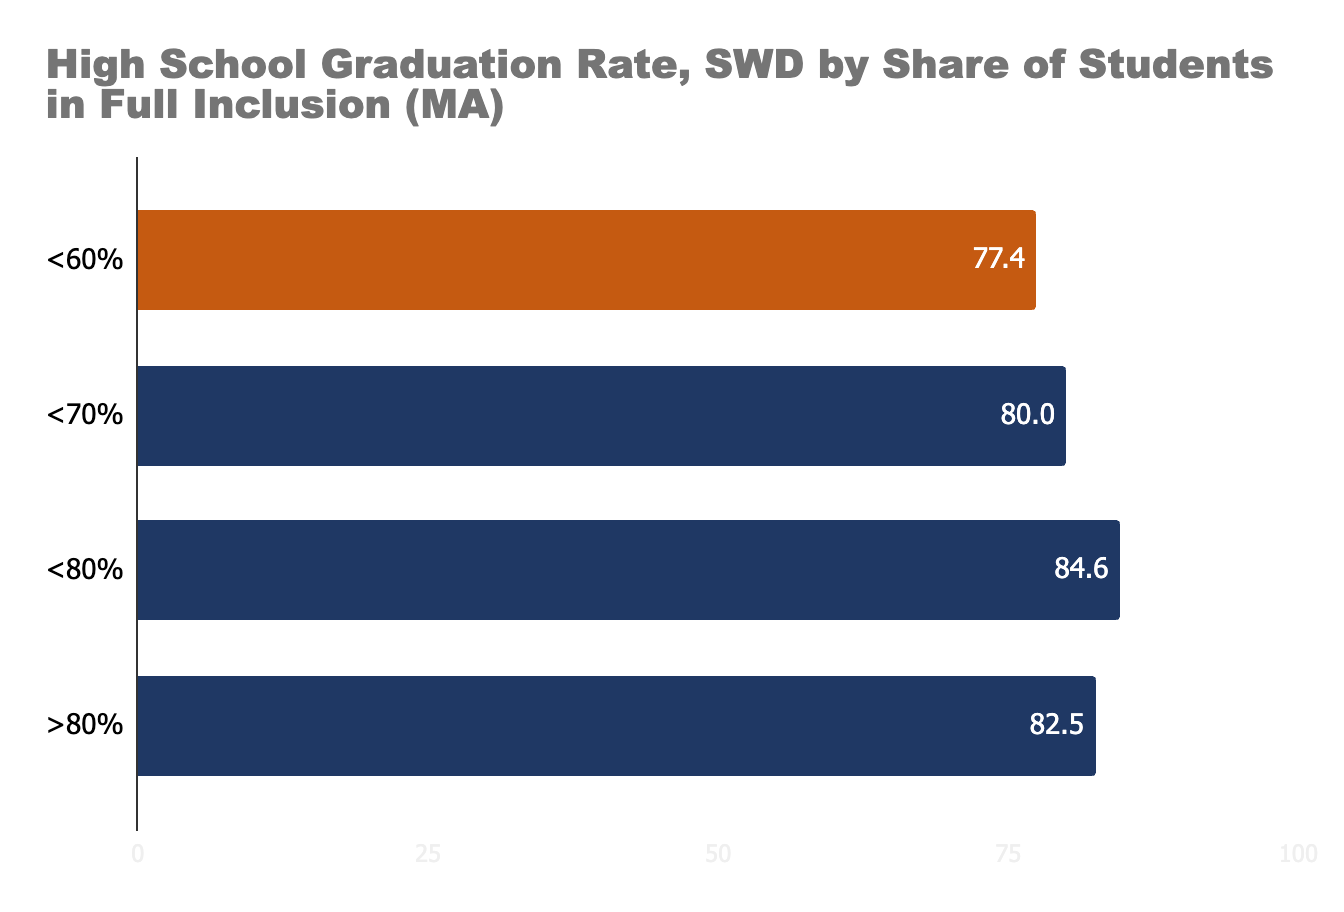
Kids may be missing out. When you run data from the MA special education results report, there is a clear correlation between the degree of full inclusion and various outcomes.
The school districts with higher degrees of full inclusion post higher MCAS proficiency rates, better attendance, and higher graduation rates. School districts with less inclusion - like Boston, in lowest quartile here - do worse.
There is some demographic noise here. The ~400 districts and charters included range in their size, complexity, and need. A scan of communities with the best outcomes for students with disabilities might as well be a Coldwell Banker brochure. But school districts with the most inclusion - and better outcomes - also had the highest average percentage of high-needs students (56.8%).
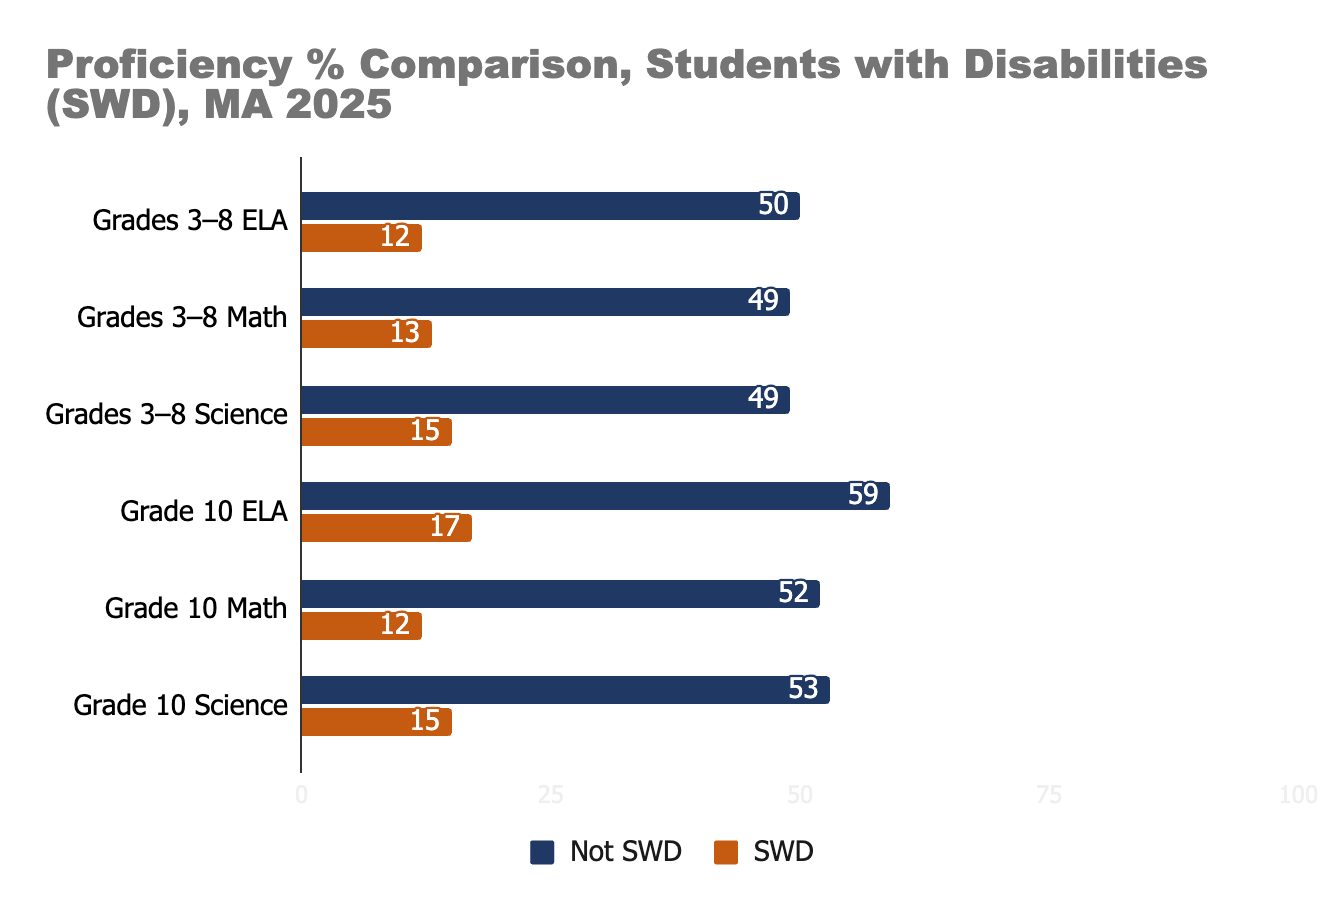
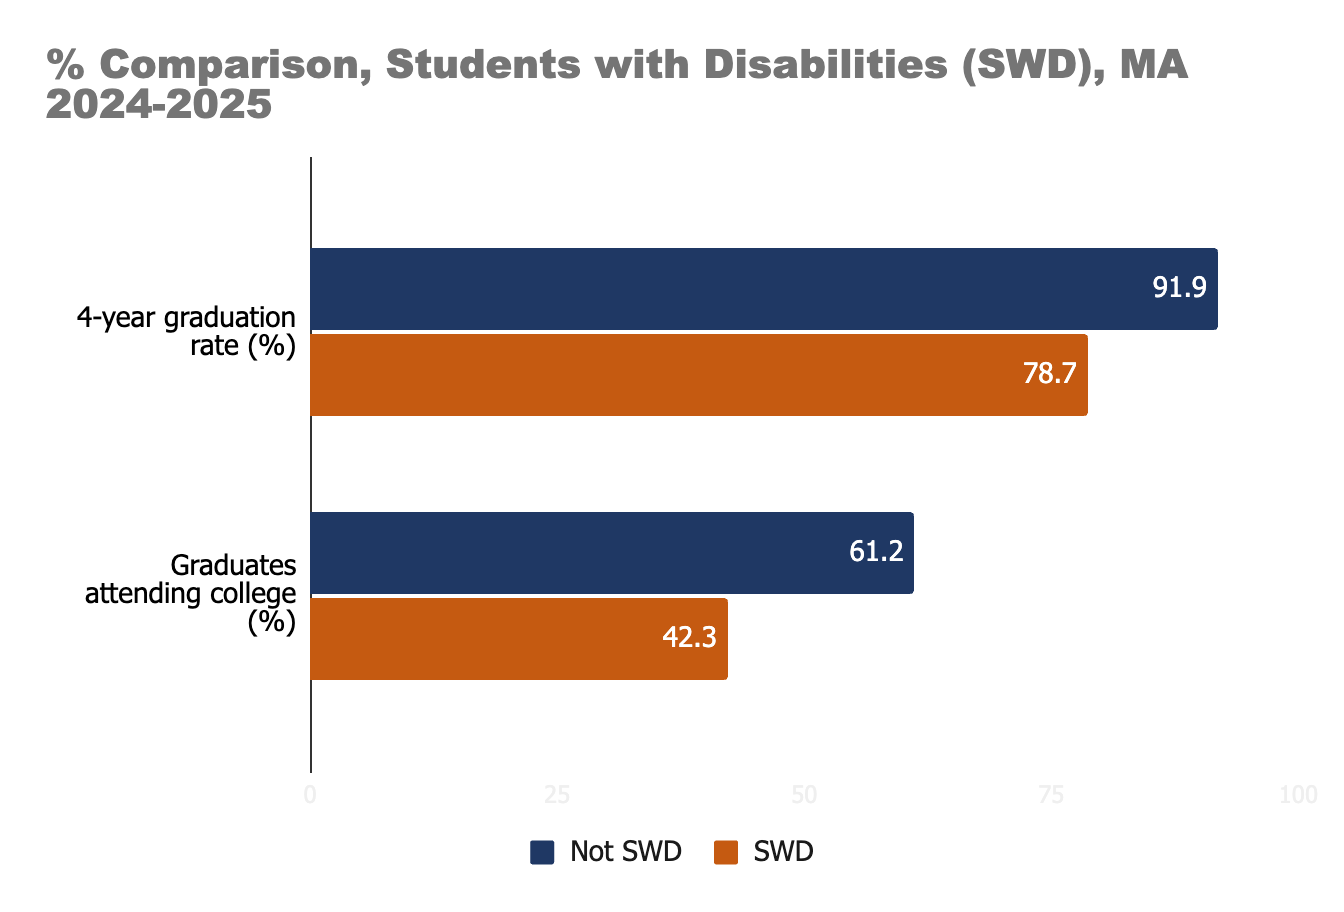
More importantly, we should not forget that success is relative here, given the massive gaps in outcomes between students with disabilities and their peers.
And here lies the real issue with this policy debate: the input is too often the end itself. By providing the program (in this case, inclusion), the accommodations, and the compensatory services, schools have done their job, irrespective of the outcomes. We ask schools to adopt programs rather than asking which schools that have outstanding outcomes for their students with disabilities.
Sadly, that list is quite small in Massachusetts. But that also eliminates the excuse to actually go and see what they are doing.
My guess is that it is not just inclusion.
Schools
Boston School Committee met on Thursday. Full agenda and materials here, including a summary of Superintendent Skipper’s annual evaluation.
The meeting had an unusual amount of non-BPS school content, with state-required reviews of multiple Horace Mann charters as well as several new private schools: Douglass Ridley, Alpha (which seems to really follow the tech ethos to move fast and break stuff), and the South End campus remaining from the Croft closure.
School Committee members are done for the year, but students and teachers will be in classrooms for two more weeks.
The district has a little more money coming in because of bus fines.
The district has a lot more money coming in because of $12.8M from Bloomberg Philanthropies that will fund expanded apprenticeships/trade jobs out of Madison Park. This is the second recent, significant investment by Bloomberg in career and technical education in Boston (EMK received $37.8M for its expansion and health care partnerships in 2024).
Wednesday’s Boston City Council meeting was effectively stopped by protestors calling for reinstating more youth jobs in the budget. Dramatic, but not an atypical concern: cities and towns across Massachusetts are facing staffing cuts.
The two chambers of Massachusetts legislature have reached a consensus on how to address the rash of attempted “book bans.”
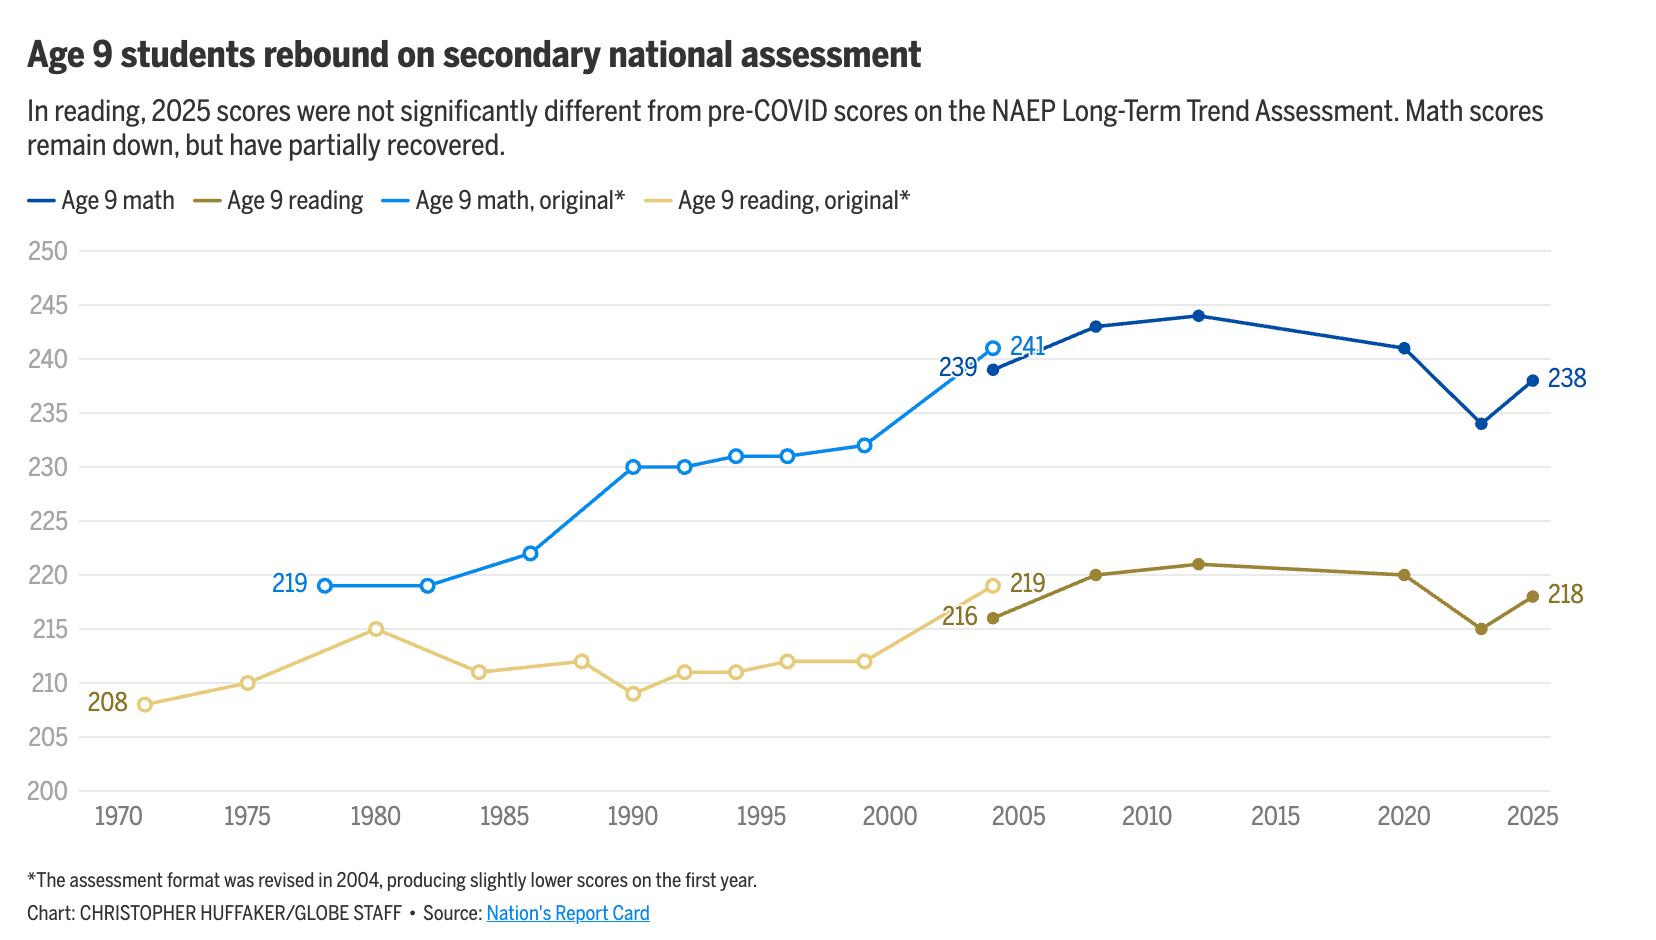
We have officially reached the “best of times, worst of times” stage of NAEP performance. It was encouraging to see headlines about recent gains for younger students in math and reading.

It is less encouraging when you look at the whole graph and see performance still near a 20-year low.
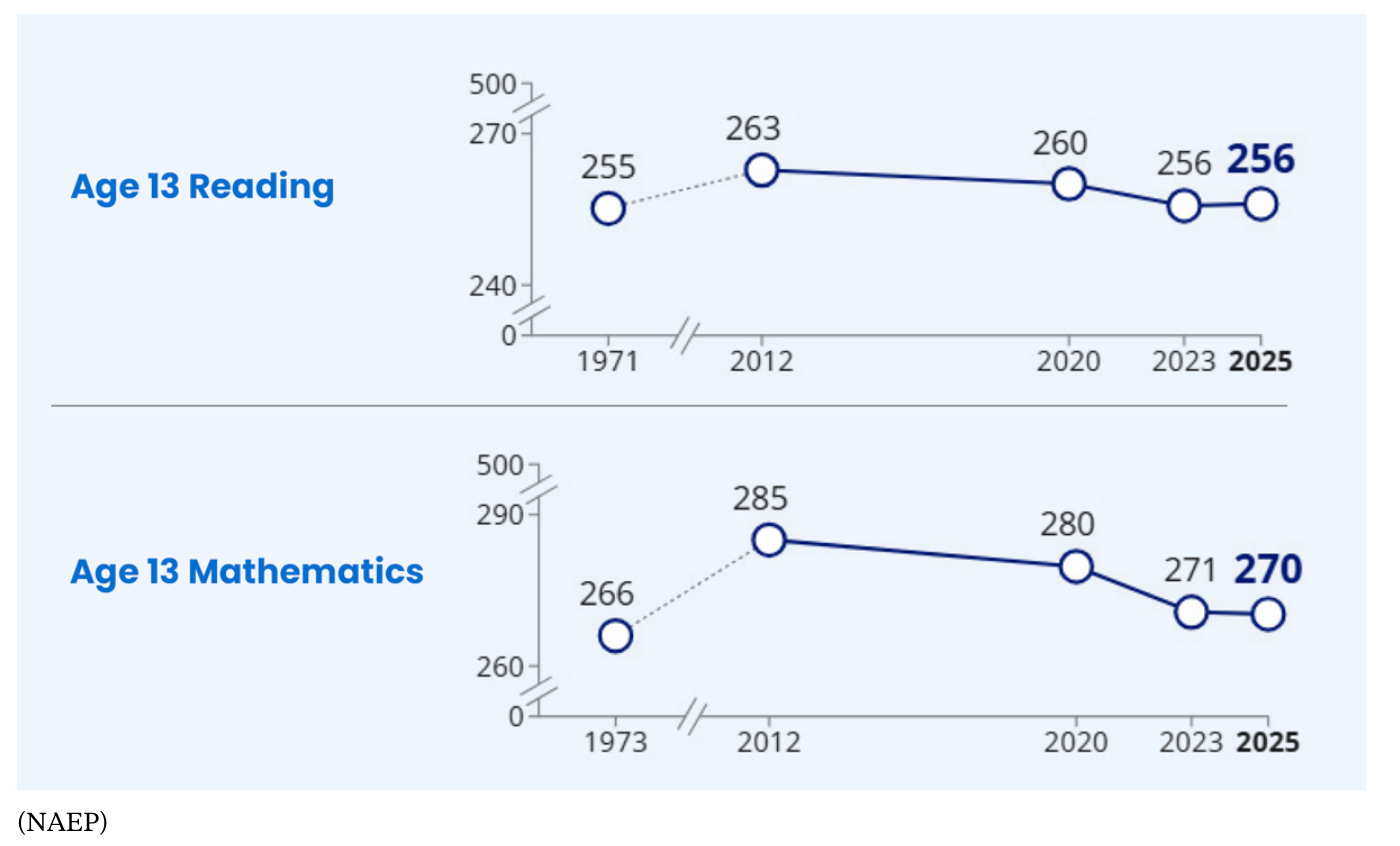
And the 13-year old data is no fun either.
Tim Daly had a good idea. He tracked the kids who started school in 2010; as judged by NAEP, they were doing great, until they weren’t. Using survey and research data, he offers probably the clearest - while also nuanced - summary I have seen of why the wheels started coming off the bus 10-15 years ago. Good add-on by Chad Adleman, pointing to the decline in kids taking algebra by 8th grade, too.
Technology may have achieved a new frontier of efficiency: there are fewer children to teach now. A new study - with a clever research design - attributes up to half of the fertility decline since 2007 to iPhone usage.
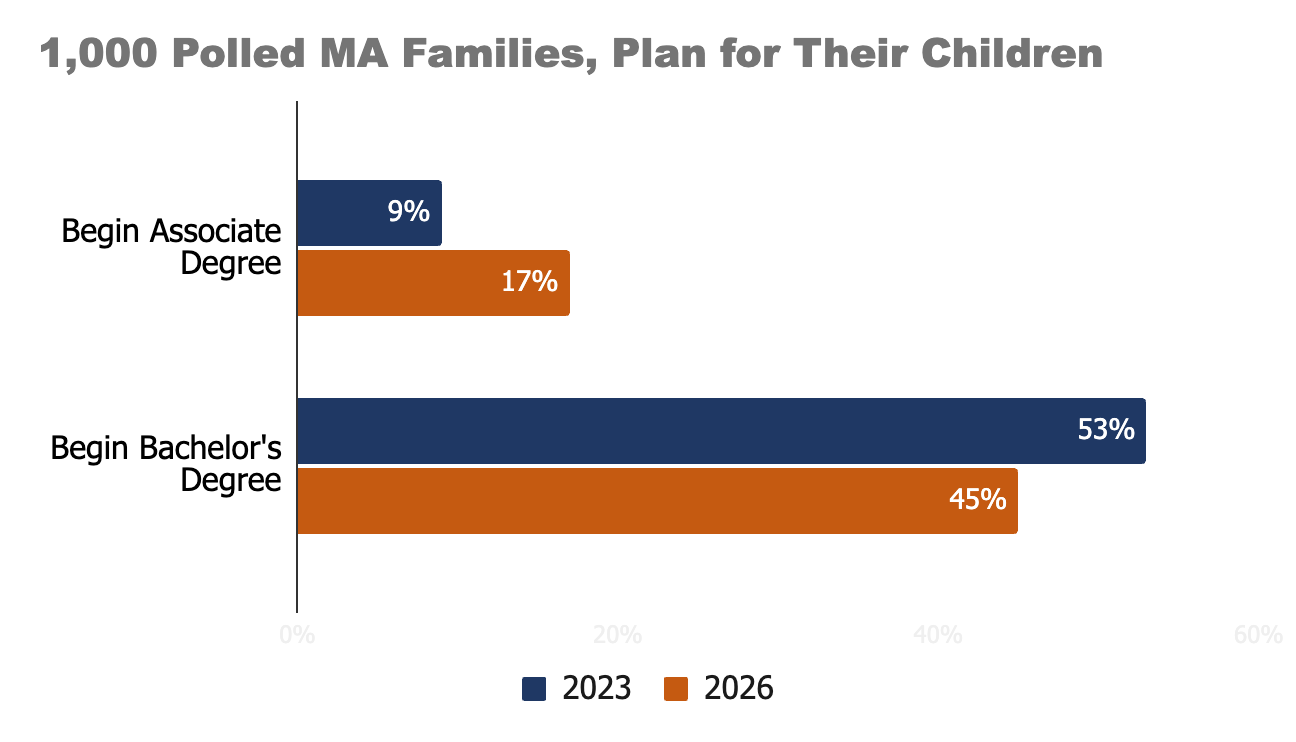
A new EdTrust/MassInc poll shows Massachusetts families shifting away from pursuing a Bachelor’s degree to an Associate degree, now very accessible through free community college throughout Massachusetts.
The “ROI” argument seems sensible when you are comparing an investment of $0 versus $100K. But it is worth taking a beat on the “return” side of the equation.
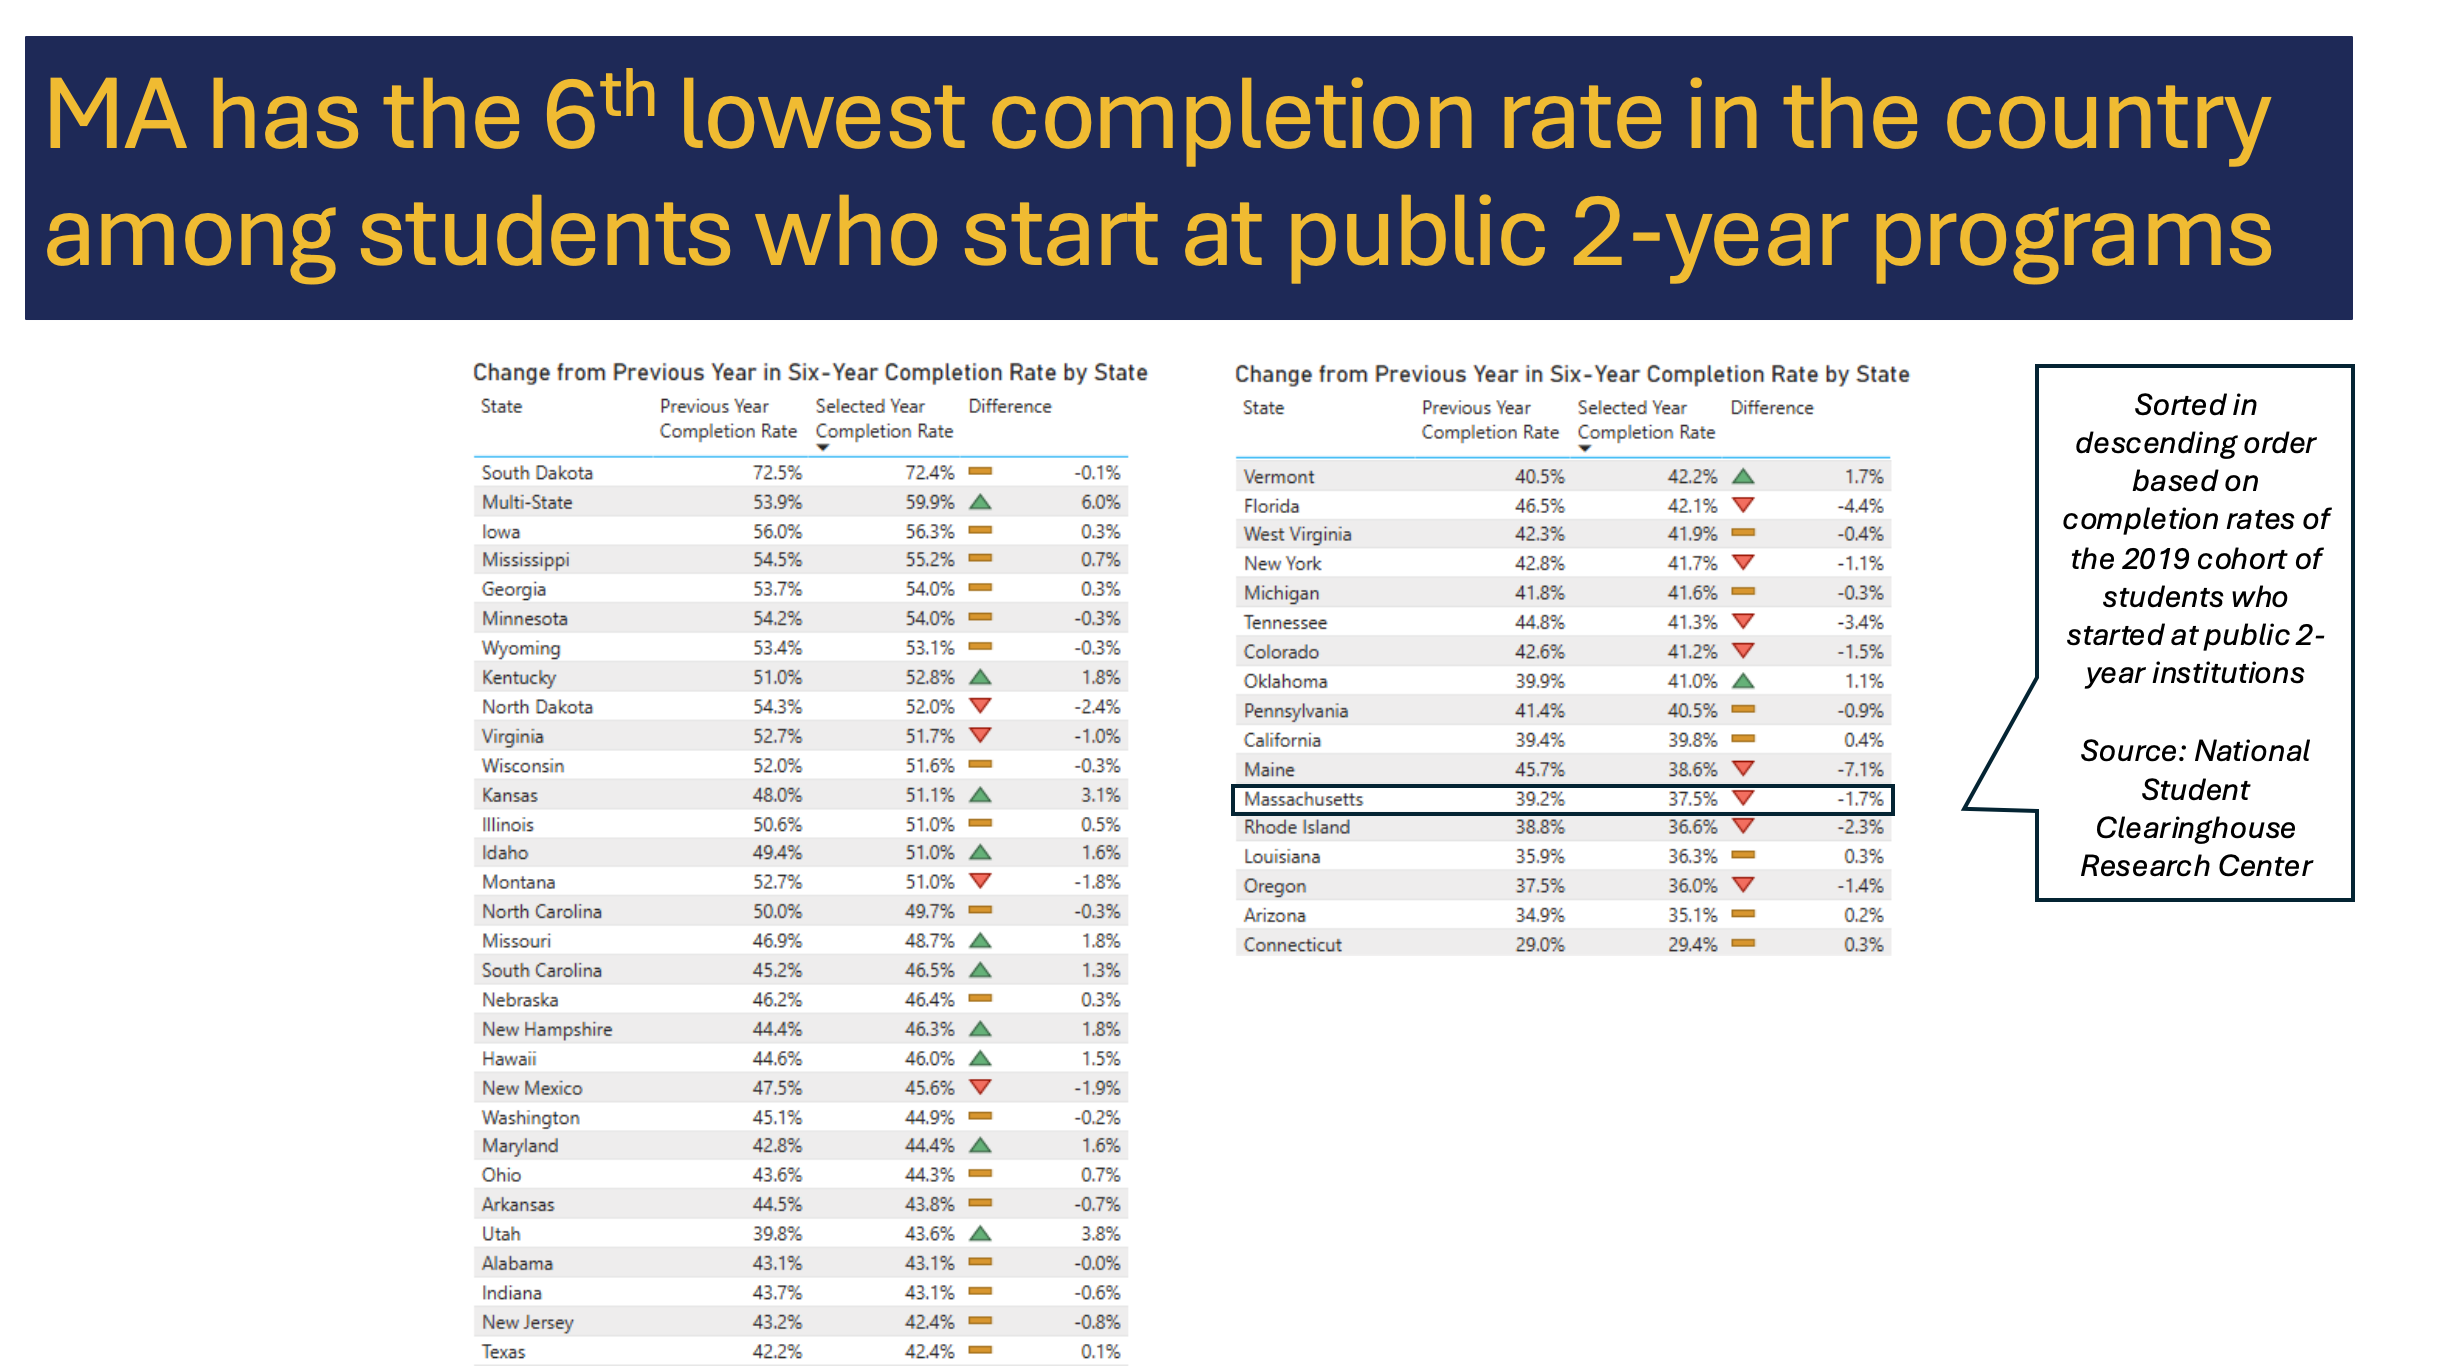
The average graduation rate for Bachelor’s degree awarding institutions in America is nearly 30 points higher.
Hampshire College will stay open a bit longer.
Sir, the school leaders in Boston don’t even understand what inclusion means in historic educational speak. You need to talk to somebody from the inside to give you the real issues. Someone who’s willing to give the real raw dirt. They confuse inclusion with inclusivity, diversity, equity, and leave out special ed. All about race to them.